Most data work starts in a spreadsheet. That works until the file gets large or the analysis needs to be repeated.
Spreadsheets can become slow, and the steps behind a result are hard to review. SQL handles larger datasets, but quick exploration often turns into a pile of queries. BI tools add setup before you can answer a simple question.
I built Repere for the space between them. It lets me open a file, explore it, and keep every step as a pipeline I can review and replay.
The approach
Repere turns the browser into a local data workspace.
DuckDB-Wasm runs the database in WebAssembly. I can query CSV, JSON, JSONL, Parquet, and Excel files without sending them to a server.
The app is open source under the MIT license. The core browser workflow needs no account or backend.
The pipeline
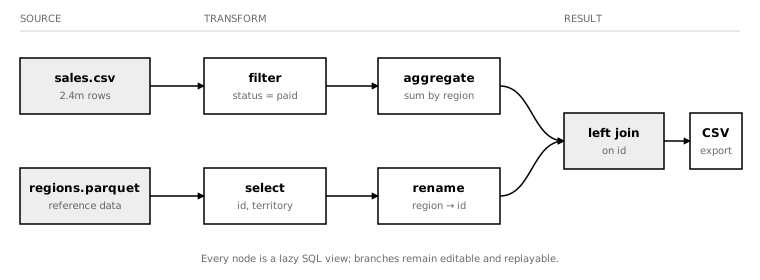
Every file starts as a node. Each operation creates another node linked to its parent: filter rows, join tables, group values, or write SQL.
Together, these nodes form a directed acyclic graph: data moves forward, but the pipeline can branch and rejoin. I can try two ideas from the same source without changing it.
Each derived node is a SQL view. Repere does not copy every intermediate result. DuckDB runs the full chain when I open a node or export its data.
This lazy model keeps pipelines light, but it does not remove the browser’s limits. DuckDB still needs enough memory to run the final query.
The canvas shows the whole graph. I can open any node, branch from it, or delete it. Deleting a node also removes its descendants because they depend on it.
Operations
Repere covers the common steps I need while exploring data:
- filter, sort, limit, select, and remove duplicates;
- add, remove, rename, reorder, and cast columns;
- edit cells, transform columns, fill nulls, and replace values;
- group, pivot, unpivot, and use window functions;
- join or union datasets;
- write raw SQL when the visual tools are not enough.
Each step becomes part of the same pipeline, whether I create it from a dialog or with SQL.
Pivot tables
Pivot tables are useful because they combine a quick summary with a path back to the source rows.
I can choose row fields, a column field, and several value calculations. Repere can add subtotals and a grand total, and groups can be expanded or collapsed.
Clicking a value creates a filtered node with the rows behind that value. This makes it easy to check an outlier or verify a total.
A pivot is a final display by default. If I want to keep transforming it, I can flatten it into a regular table node.
SQL editor
The SQL editor knows the current schema and suggests tables, columns, and types. It can also format a query and show the result beside the editor.
When a query is useful, I can save it as a node. I can also edit an existing SQL node; every descendant then uses the updated query.
The grid
The grid renders only the visible rows and, for wide tables, the visible columns. This keeps scrolling responsive even when a dataset has millions of rows.
Column headers include small distribution charts. I can pin, resize, reorder, or hide columns. Selecting cells shows quick facts such as count, unique values, sum, average, median, minimum, and maximum.
Local by default
Repere does not upload the files I open. In the web app, DuckDB-Wasm reads them and runs SQL inside the browser.
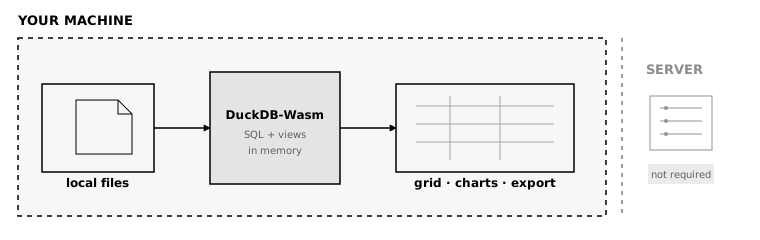
This is useful for financial records, customer data, or any file I do not want to upload to another service.
Sharing and replay
I can share a session in two ways.
A .repere file stores the pipeline and its view definitions. It can also include selected source datasets. Files that are too large to embed stay as references and must be provided when the session is opened.
For a small session, Repere can put the same session data in the URL hash. The link carries it, so the Repere server does not store it. URL length limits make this option best for pipelines without large embedded files.
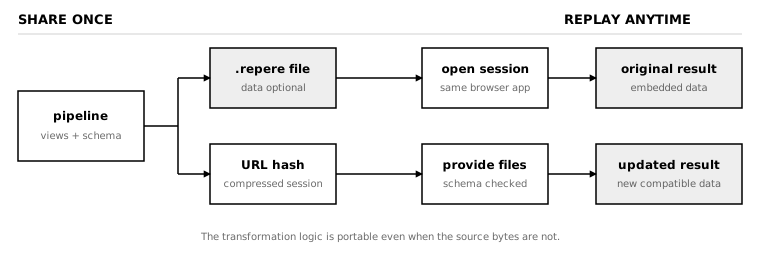
When data is not embedded, Repere asks for the missing files. They do not need to contain the same rows, but they do need the columns used by the pipeline.
Schema checks allow compatible types. One numeric type can replace another, as can string or date types. Extra columns are fine. Missing columns or a change from a number to text are not.
This lets me build a pipeline on January’s sales file and run it again on February’s file.
If a source file is unavailable, I can skip it. Repere creates an empty placeholder with the expected schema. The graph stays intact, and I can provide the file later.
Where I want to take it
Repere has already grown beyond the first browser prototype. It now includes charts, dashboards, deeper profiling, and a desktop build for larger files.
I want to keep the same local-first base while adding more live connectors and better team features: shared dashboards, access controls, audit logs, SSO, and private deployment.
If I add a paid tier, it will focus on those team features. The local browser experience will stay free and serverless.
Summary
Repere gives me SQL power without asking me to set up a database or upload a file. The visual pipeline keeps the work clear, repeatable, and easy to share.
Try it at repere.ai.